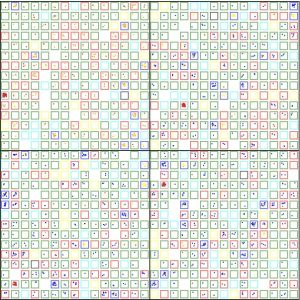
Why create this visualization?
This is a good dashboard for the public that gives us an intuitive insight into how the Covid cases are linked to each other. This tool uses technology and a bit of manual data entry, by indexing all the recent cases and building template dashboard, we can create a community case cluster graph visualization that:
- is far easier to update than manually drawing out the clusters
- allows us, at a glance, to intuitively get case relationship insights
- allows us to search and find each case by ID in the dataset (not possible on the MOH site).


